data maps are like time machines...
...Click on the date, and there you are! When I first entered Social Explorer, I watched the slideshow of race maps of New York City over and over. Then I compulsively tried different combinations of dates with a certain set of categories. After a few hours of this, my fiancé walked in the room and asked me what I was doing. I said "Watch this!" and showed him where Austrians in the U.S. were mostly living in the year 2000 (he's half Austrian). I was disappointed to see that he did not share my enthusiasm. Then I showed him the race map from New York.
"What does that tell you?" he asked. "What did race mean to people in 1910, and what did it mean to people in 2000? Did they ask people the same questions?"
We had a very long discussion about this. I argued that, yes, there are previously constructed boxes in censuses into which reality is made to fit. But there are many things we can learn not only through the prism of censuses, but also from the shape of the prism itself. In "marital status" before the year 2000, for example, there was no category for "divorced," just "married" or "never married." Before 1960, as far as I can see, there was no category for "race" at a national level. In 1960, moreover, the race category had no subcategory for "Hispanic." Then I stopped and wondered when "Hispanic" became a "race," given that Latin Americans have African, Native American, European, Asian, and Middle Eastern ancestries. It became an official race in the United States in 1970. Given the slippery nature of the category, by1980 all races had the disclaimer "non-Hispanic" next to them. It remained the same through 1990, but by the year 2000, "Hispanic" had three modifiers next to it: Black, White, Other.
I find this fascinating--these efforts to more precisely define a group of people that share a vague something in common, something that is even shared with some Europeans (the Spanish were listed as Hispanic in the "foreign born" section in the 2000 census). I find it fascinating because these are matters of self-identification, but the choices largely dictate the reality that is reflected in the numbers. A census in El Salvador at mid-century left out "Indian" as a category, for example, and suddenly it became a "reality" that all Indians had assimilated into the larger culture somehow overnight. And yet, as flawed as the collection of data may be, it tells us something important. As I watch races shift around Manhattan, Queens, the Bronx and Brooklyn, or grow fainter or darker around a particular point as the date changes in the upper left hand corner, I know that I am watching imperfect data imperfectly reflecting a seismic shift. But the shift is there.
My fiance's questions point to a fundamental difficulty in comparing such vast amounts of information: the sources might differ in content and in kind. George Alter's articles demonstrate how one might try to control for such gaps when the information provided is pretty much bare bones. Data can never speak for itself; it is up to the researcher to take pre-conditioned data and interpret shifts while taking into account variables that were not recorded. In "Theories of Fertility Decline," I found his evaluation of the "rising cost of children" quite instructive: "Subjects in surveys and interviews overwhelmingly report that children cost more now than they did in the past... On close examination, however, they are not describing a change in the costs of children as much as a change in their own definition of appropriate childrearing.... Historically, children have become more expensive not because the prices of commodities consumed by children have risen, but rather because parents have decided to invest more in goods and services for their children" (16). How does one control for culture? Culture is one of those things that have proven almost impossible to define--yet there it is. He also points to the reasons why doing this kind of research with large amounts of such data is both necessary and a little unsettling: the negative result. When theoretical frameworks are informed by a particular vision of the past, historical analysis must be both nuanced and as thorough as possible. These theories are, in many cases, the drive behind policies.
All these questions have made me really think about my own research--and the possibility of a negative result. My starting point is now as shaky (and as vague) as ever: the Catholic Church became increasingly involved in matters of social justice throughout the twentieth century (I can come up with a more compelling way to put it, but when it comes down to it, that's what it is). It was controversial. Many people stopped being Catholic and many others embraced the conservative Opus Dei. The Church was not a monolith and there was a lot of disagreement (more than we usually think) from within. Okay. So far in my academic career, I have concentrated on interpreting sources written by the institutional clergy. Articles, books, homilies. But I have this nagging feeling that these sources will tell me just as much as what I've learned about the Jansenist controversies in 18th century France: the arguments in journals. How many people read those journals? How many people could read at all? Who cared?
How should I phrase my questions? What sources are available? One thing I might ask is, how many people came into contact with the Church at an institutional level throughout their lives and how did this change in the twentieth century? I can only track what the institutional church was saying or disagreeing about, but it is far more difficult to track people's reactions to what was being said. A priest can yell all he wants from a pulpit, but if there's only one person in the pews, what does that say? What if he yells and the Church is overflowing? Early on in my research I thought it might be a good idea to try to track people's use of sacred space as time went on, and see how it shifted with the changing ideology. The task, however, seemed too monumental. When I brought it up at my review, one of Peter Guardino's excellent questions was, "what if people were just going to different churches because of urban expansion?" How would I control for that?
Here is what I came up with.
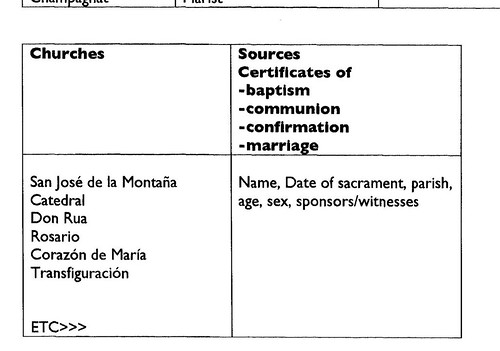
So, by enlisting the help of several people (possibly many) for the data entry, I could enter the names of people as they go through the sacraments. Do they stay within their parish church throughout their lives? I can pretty much track where people are going to church (roughly), and whether there were massive shifts in affiliations at certain points in time that do not correspond to urban growth. This is just a rough idea of how the information might be organized. Of course, this would not substitute but complement my initial approach to the research. But that fundamental disconnect between the people doing the talking and the people hearing it might be bridged in this way.
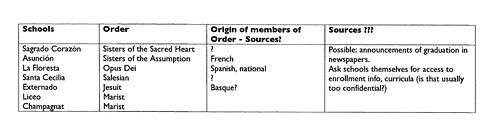
I might also be able to do something with schools, but it is obviously still very unclear exactly what:
posted by puesiesque @ 4:50 PM
0 comments
![]()

0 Comments:
Post a Comment
<< Home